Descriptive Statements:
- Use appropriate formats for organizing and displaying data.
- Analyze data in a variety of representations.
- Analyze the use of measures of central tendency and variability.
- Analyze the effects of bias and sampling techniques.
Sample Item:
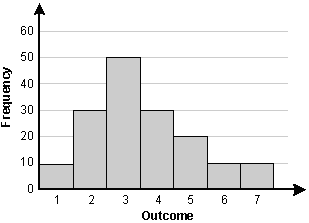
Which of the following statements describes the set of data represented by the histogram below?

The vertical axis is labeled frequency. The horizontal axis is labeled outcome. The values of the bars are:
Outcome, 1, frequency 10
Outcome, 2, frequency 30
Outcome, 3, frequency 50
Outcome, 4, frequency 30
Outcome, 5, frequency 20
Outcome, 6, frequency 10
Outcome, 7, frequency 10
- The mode is equal to the mean.
- The mean is greater than the median.
- The median is greater than the range.
- The range is equal to the mode.
Correct Response and Explanation (Show Correct ResponseHide Correct Response)
B. This question requires the examinee to analyze data in a variety of representations. The mean can be calculated as [10(1) + 30(2) + 50(3) + 30(4) + 20(5) + 10(6) + 10(7)] ÷ 160 = 3.5625left bracket 10 left parenthesis 1 right parenthesis plus 30 left parenthesis 2 right parenthesis plus 50 left parenthesis 3 right parenthesis plus 30 left parenthesis 4 right parenthesis plus 20 left parenthesis 5 right parenthesis plus 10 left parenthesis 6 right parenthesis plus 10 left parenthesis 7 right parenthesis right bracket divided by 160 equals 3.5625. The median is the 50th percentile, which is 3. The mode is the most frequent value, which is 3. The range is 7 – 1 = 67 minus 1 equals 6. Thus "the mean is greater than the median" is the correct response.
Descriptive Statements:
- Determine probabilities of simple and compound events and conditional probabilities.
- Use counting principles to calculate probabilities.
- Use a variety of graphical representations to calculate probabilities.
- Select simulations that model real-world events.
- Analyze uniform, binomial, and normal probability distributions.
Sample Item:
The heights of adults in a large group are approximately normally distributed with a mean of 65 inches. If 20% of the adult heights are less than 62.5 inches, what is the probability that a randomly chosen adult from this group will be between 62.5 inches and 67.5 inches tall?
- 0.3
- 0.4
- 0.5
- 0.6
Correct Response and Explanation (Show Correct ResponseHide Correct Response)
D. This question requires the examinee to analyze uniform, binomial, and normal probability distributions. A normal distribution is symmetric about the mean. Thus if 20% of the heights are less than 62.5 inches (2.5 inches from the mean), then 20% of the heights will be greater than 67.5 inches (also 2.5 inches from the mean). Thus 100% – (20% + 20%) = 60%100 percent minus left parenthesis 20 percent plus 20 percent right parenthesis equals 60 percent and the probability is 0.6 that the adult will be between 62.5 and 67.5 inches tall.
Descriptive Statements:
- Apply concepts of permutations and combinations to solve problems.
- Analyze sequences and series including limits and recursive definitions.
- Perform operations on matrices and vectors.
- Apply set theory to solve problems.
Sample Item:
Five different algebra textbooks, two different calculus textbooks, and four different geometry textbooks are to be arranged on a shelf. How many different arrangements are possible if the books of each subject must be kept together?
 left parenthesis 5 times 2 times 4 right parenthesis the quantity cubed
 11 factorial over 5 factorial 2 factorial 4 factorial
 5 factorial 2 factorial 4 factorial 3 factorial
 11 cubed over left parenthesis 5 factorial 2 factorial 4 factorial right parenthesis the quantity cubed
Correct Response and Explanation (Show Correct ResponseHide Correct Response)
C. This question requires the examinee to apply concepts of permutations and combinations to solve problems. If the books in each of the 3 subjects must be kept together, then the number of ways the groups of books can be arranged by subject is represented by 3!3 factorial. If there are n books within a subject, the number of ways the books can be arranged is n!. Thus the algebra books can be arranged in 5!5 factorial different ways, the calculus books can be arranged in 2!2 factorial different ways, and the geometry books can be arranged in 4!4 factorial different ways. Since there is independence between the different arrangements computed, the total number of ways the books can be arranged is the product of all the factorials 3! 5! 2! 4!3 factorial 5 factorial 2 factorial 4 factorial which is equivalent to 5! 2! 4! 3!5 factorial 2 factorial 4 factorial 3 factorial.

